Dr Belen Marti-Cardona
Academic and research departments
Centre for Environmental Health and Engineering, School of Sustainability, Civil and Environmental Engineering.About
Biography
I am a civil engineer specialised in hydrological and hydraulic modelling, and in the exploitation of Earth observation data for hydrological and environmental engineering applications. My experience in Earth observation includes the use of SAR, thermal and optical imagery from space, aircraft and UAV platforms. In addition to my permanent academic role, in the last few years I have worked as a data scientist for companies on the analysis and integration of Earth observation data into their commercial products.
I graduated in MEng civil engineering from the Universitat Politecnica de Catalunya-BarcelonaTech (UPC) in 1997. My early career experience was in the construction of water-related infrastructure, followed by their design in the prestigious engineering company SENER, Spain. I then moved to the engineering firm, Jacobs in Reading, UK, where I worked on the numerical simulation of flood events and flood mapping, for projects commissioned by the Environment Agency. This experience provided me with priceless expertise in the state-of-the art hydrodynamic numerical modelling and digital mapping techniques. I became a chartered engineer by the ICE at that time.
Funded by the prestigious La Caixa fellowship, I completed a two-year MSc at the University of California, Davis, USA (2004). There, I had the privilege to learn from and work as a research assistant with world-leading scientists in the fields of hydrology and remote sensing.
Back in Barcelona I joined the UPC, Institut Flumen-CIMNE, as a research and teaching assistant. My involvement in an exciting project at the wildlife sanctuary of the Doñana wetlands gave me the unique opportunity to sample the site on countless (and sometimes wild) occasions, and to compare the sampled biophysical parameters with satellite SAR data and hydraulic modelling simulations. That work provided me with deep understanding of the SAR-soil-water-vegetation interaction, and made up my PhD too! My participation in other Flumen-CIMNE projects allowed me to exploit thermal and optical satellite and drone data, with a couple of nice competitive projects won and successfully completed in the way.
Life matters brought me to the UK, where I am currently a Lecturer in Water Resources Modelling and Remote Sensing. Soon after my arrival, I developed and promoted the launch of a module on GIS and Remote Sensing which is currently being taught. I also teach hydrology and hydraulics at different levels, and feel proud to have infected my enthusiasm for those disciplines to some of my students. I am also pleased with my holistic background as an engineer, which places me in an advantaged position to develop novel applications of remote sensing data.
My research interests involve innovative applications of remote sensing data to water resources problems, including sustainable use, impact of soil moisture on rainfall-runoff transformations, drought mapping and monitoring, evaluation of evapotranspiration water losses per land cover type, assessment of climatic and anthropogenic spatiotemporal impacts, and large scale near-real time crop and soil moisture mapping at the field scale (“field scale” being crucial). I am thrilled about implementing artificial intelligent analysis into these applications.
Areas of specialism
University roles and responsibilities
- Lecturer in Water Resources Management and Hydraulic Modelling (ENGM057)
- Lecturer in GIS and Remote Sensing (ENGM285)
- Lecturer in Environmental Engineering and Hydrology (ENG3177)
- Lecturer in Hydraulics and Environmental Quality (ENG2101)
My qualifications
News
ResearchResearch projects
Remote quantification of soil organic carbon- Principal investigator: Dr Belen Marti-Cardona
- Start date: 01 September 2021
- End date: 31 March 2022
- Funding amount: £88,112
Numerical modelling of log dams: A tool for building guidance - proof of concept- Principal investigator: Dr Belen Marti-Cardona
- Start date: 01 January 2021
- End date: 31 March 2021
- Funding amount: £38,334
Maize mapping and sustainable water use in Afghanistan- Principal investigator: Dr Belen Marti-Cardona
- Start date: 01 June 2020
- End date: 28 February 2021
- Funding amount: £97,285
Integrating hydrological modelling and satellite data to inform crop field soil moisture- Principal investigator: Dr Belen Marti-Cardona
- Start date: 01 September 2020
- End date: 31 March 2021
- Funding amount: £77,136
Research projects
- Principal investigator: Dr Belen Marti-Cardona
- Start date: 01 September 2021
- End date: 31 March 2022
- Funding amount: £88,112
- Principal investigator: Dr Belen Marti-Cardona
- Start date: 01 January 2021
- End date: 31 March 2021
- Funding amount: £38,334
- Principal investigator: Dr Belen Marti-Cardona
- Start date: 01 June 2020
- End date: 28 February 2021
- Funding amount: £97,285
- Principal investigator: Dr Belen Marti-Cardona
- Start date: 01 September 2020
- End date: 31 March 2021
- Funding amount: £77,136
Sustainable development goals
My research interests are related to the following:






Publications
Changing climate is increasingly influencing the rainy seasons and posing significant challenges for agriculture and water resource management in vulnerable regions. The study examines the spatiotemporal variation of rainy seasons in the Upper Blue Nile Basin (UBNB) of Northwestern Ethiopia using projections from the CMIP6 climate models to assess potential impacts on agricultural and water planning. We analyzed observed and projected precipitation data across three Shared Socioeconomic Pathway (SSP) scenarios: SSP1-2.6, SSP2-4.5, and SSP5-8.5, spanning near-term (2015–2044), mid-term (2045–2074), and long-term (2075–2100) periods. To correct systematic biases in model outputs, a power transformation technique was applied to precipitation data from seven CMIP6 models. The finding of the study showed that the INM-CM5-0 model is the most accurate in simulating precipitation patterns, forming the basis for our detailed analysis. Our findings reveal significant shifts in the timing and duration of rainy seasons across all scenarios, with more pronounced changes under the highest emission pathways, SSP5-8.5. The SSP5-8.5 scenario indicates the most substantial extension in the length of rainy season, particularly in lowland areas, due to both earlier onset and delayed cessation. Conversely, highland and midland regions are projected to experience shorter rainy seasons, lasting between 82 and 130 days, driven by delayed onset and earlier cessation. These shifts could profoundly affect agricultural productivity, necessitating adjustments in planting and harvesting schedules by several months. Under high-emission scenarios, crop cycles may become misaligned with traditional planting windows, especially in highland areas where shorter rainy seasons may constrain crop viability. This study highlights the urgent need for adaptive strategies, such as the practice of early-maturing crop varieties, to enhance resilience to the change of projected seasonal rainfall patterns. Proactive measures, particularly in highland communities, are crucial for maintaining food security and effective water resource management to enhance adaptation options to climate change impacts in the area. These insights can guide targeted agricultural policies and resource planning, helping to mitigate the adverse impacts of climate change on food and water security.
Accurate estimation of soil properties is crucial for optimizing agricultural practices and promoting sustainable resource management. Hyperspectral imaging provides a non-invasive means of quantifying key soil parameters, but effectively utilizing the high-dimensional hyperspectral data presents significant challenges. In this paper, we introduce HyperSoilNet, a hybrid deep learning framework for estimating soil properties from hyperspectral imagery. HyperSoilNet leverages a pretrained hyperspectral-native CNN backbone and integrates it with a carefully optimized machine learning (ML) ensemble to combine the strengths of deep representation learning with traditional ML techniques. We evaluate our framework on the Hyperview challenge dataset, focusing on four critical soil properties: potassium oxide, phosphorus pentoxide, magnesium, and soil pH. Comprehensive experiments demonstrate that HyperSoilNet surpasses state-of-the-art models, achieving a score of 0.762 on the challenge leaderboard. Through detailed ablation studies and spectral analysis, we provide insights on the components of the framework, and their contribution to performance, showcasing its potential for advancing precision agriculture and sustainable soil management practices.
Monitoring soil moisture (SM) on individual crop fields is of great interest for agricultural applications. Synthetic aperture radar (SAR) systems such as Sentinel-1 provide sensitivity to surface SM at a spatial resolution compatible with crop-field monitoring. Different algorithms have been proposed to relate SAR backscattering to SM, yet most overlook soil texture as a modulating factor. This study investigated the influence of soil texture, closely related to soil hydrological properties, on the relationship between Sentinel-1 C-band backscattering and surface SM using extensive data from the agricultural sites of the COSMOS-UK monitoring network. Our results evidenced the semi-empirical first-order relationship between SM and field-averaged VV backscattering, and found that the gradient of their linear regression was indicative of soil texture. For instance, in sandy loam soil the S1 response showed high sensitivity to SM with a change of 1.69% SM per dB; this compared with the lower sensitivity of a clayey soil at a change of 4.81% SM per dB. These findings lay the ground for the retrieval of field-scale soil hydrological properties from backscatter temporal patterns, when used in synergy with rainfall data and process-based soil-moisture models.
River systems worldwide are under significant anthropogenic pressures and climate-related challenges, leading to ecosystem degradation and increased flood risk. This chapter demonstrates how Nature Based Solutions (NbS) can contribute to river restoration while reducing flood risk, supporting wider sustainable goals. To this end, this chapter evaluates the effectiveness of NbS interventions in river restoration and flood risk management in the Kitwe City, Zambia. The methodology involves using a hydraulic model to simulate river flow under different NbS scenarios (retention ponds and woodland reforestation), and to compare the simulated flood depth and flow velocity in pre- and post-intervention conditions. The findings indicate that the presence of NbS significantly reduces flood risks, with retention ponds and woodlands leading to flood depth reductions ranging from 0.09 m to 0.18 m and 0.06 m to 0.11 m, respectively. Regarding flow velocities, retention ponds reduced them by an average of 0.11m/s, and woodlands, by 0.07 m/s. These results indicate that both NbS types reduce flood depth and velocity, with ponds being slightly more effective than woodland in the particular setting of the Kitwe District. The findings suggest that integrating NbS into river restoration can mitigate flood risks, improve ecosystem resilience, and contribute to long-term sustainability. These results inform risk management policies and emphasise the need for interdisciplinary collaboration to upscale NbS for maximum ecological and societal benefits.
The use of a pretrained image classification model (trained on cats and dogs, for example) as a perceptual loss function for hyperspectral super-resolution and pansharpening tasks is surprisingly effective. However, RGB-based networks do not take full advantage of the spectral information in hyperspectral data. This inspired the creation of HyperKon, a dedicated hyperspectral Convolutional Neural Network backbone built with self-supervised contrastive representation learning. HyperKon uniquely leverages the high spectral continuity, range, and resolution of hyperspectral data through a spectral attention mechanism. We also perform a thorough ablation study on different kinds of layers, showing their performance in understanding hyperspectral layers. Notably, HyperKon achieves a remarkable 98% Top-1 retrieval accuracy and surpasses traditional RGB-trained backbones in both pansharpening and image classification tasks. These results highlight the potential of hyperspectral-native backbones and herald a paradigm shift in hyperspectral image analysis.
Accurate detection of spatial patterns of urban growth is crucial to the analysis of urban growth processes. A common practice is to use post-classification change analysis, overlaying multiple independently derived land cover layers. This approach is problematic as propagation of classification errors can lead to overestimation of change by an order of magnitude. This paper contributes to the growing literature on change classification using pixel-based time series analysis. In particular, we have developed a method that identifies change in the urban fabric at the pixel level based on breaks in the seasonal and year-on-year trend of the normalised difference vegetation index (NDVI). The method is applied to a case study area in the south of England that is characterised by high levels of cloud cover. The study uses the Landsat data archive over the period 1984–2018. The performance of the method was assessed using 500 ground truth points. These points were randomly selected and manually assessed for change using high-resolution earth observation imagery. The method identifies pixels where a land cover change occurred with a user’s accuracy of change 45.3 ± 4.45% and outperforms a post-classification analysis of an otherwise more advanced land cover product, which achieved a user’s accuracy of 17.8 ± 3.42%. This method performs better where changes exhibit large differences in NDVI dynamics amongst land cover types, such as the transition from agricultural to suburban, and less so where small differences of NDVI are observed, such as changes in land cover within pixels that are densely built up already. The method proved relatively robust for outliers and missing data, for example, in the case of high levels of cloud cover, but does rely on a period of data availability before and after the change event. Future developments to improve the method are to incorporate spectral information other than NDVI and to consider multiple change events per pixel over the analysed period.
Accumulation of instream large wood (i.e., fallen trees, trunks, branches, and roots) at bridges during floods may exacerbate flooding, scour and cause structural failure. Yet, explaining and predicting the likelihood of a bridge trapping wood remains challenging. Quantitative data regarding wood accumulation at bridges are scarce, and most equations proposed to estimate the accumulation probability were derived from laboratory experiments , and include variables such as flow velocity, Froude number, and approaching wood volume or size which are difficult to obtain. Other evaluations based on technical reports and information regarding wood removal have been proposed but are mostly qualitative. Until now, a data-driven approach combining multiple quantitative accessible variables at the river reach and catchment scales remains lacking. As a result, the controlling parameters explaining whether a bridge is prone to trap wood are still unclear. This work aims to fill this gap by analysing a database of 49 bridges across the United Kingdom (UK) classified as prone and not prone to wood accumulation. The database contained information regarding the geometry of the bridge (i.e., number of piers and pier shape) and we added parameters describing the upstream river channel morphology, the riparian land-cover, and high-flow characteristics. We applied multivariate statistics and a machine learning approach to identify the variables that explained and predicted the predisposition of bridges to wood accumulation. Results showed that the number of bridge piers, the unit stream power, the pier shape, and the riparian forested area explained 87% of the total variability for the training dataset (0.87 training accuracy), and the selected model had a testing accuracy of 0.60 (60%). Although limited by the sample size, this study sheds light on the identification of bridges prone to wood accumulation and can inform bridge design and management to mitigate wood-related hazards.
Los humedales de alta montaña conocidos como bofedales constituyen un hábitat indispensable para numerosas especies, entre las que se encuentran los camélidos. En las últimas décadas se ha observado la recesión de algunos bofedales y lagunas andinas. En la cuenca del rio Locumba, Perú, se ha postulado que esta recesión puede estar ligada al consumo de los recursos hídricos para usos agrícolas y mineros. El estudio que aquí se presenta utiliza imágenes satelitales para determinar la superficie de agua en las principales lagunas naturales, así como el área ocupada por los bofedales y la superficie agrícola,desde la década de los 70 hasta la actualidad. La tarea incluye además el cómputo de la evapotranspiración real en las áreas cultivadas de la cuenca a partir de dos imágenes recientes correspondientes a los períodos seco y húmedo. La teledetección aporta de este modo una serie histórica de datos espaciales cuantitativos de gran valor para determinar la variación de cubiertas naturales e investigar sus causas.
ASTER and Landsat images were used for mapping the water surface temperature in the Sobrón, Mequinenza and Ribarroja reservoirs in the Ebro River, Spain. The spatially continuous information in these maps reveals the impact of the reservoir on the river natural thermal gradient in two different periods of the year. It also evidences the thermal impact intensity and extent of the refrigeration flow discharge from a nuclear power plant located on the river bank. The high spatial resolution images of the Ribarroja reservoir, acquired by the airborne hyperspectral TASI sensor, show spatial patterns which complemented the in-situ point measurements and contributed valuable data for validating the three-dimensional thermo-hydrodynamic model of the reservoir.
Hydro-meteorological hazards (HMHs) have had a strong impact on human societies and ecosystems. Their impact is projected to be exacerbated by future climate scenarios. HMHs cataloguing is an effective tool to evaluate their associated risks and plan appropriate remediation strategies. However, factors linked to HMHs origin and triggers remain uncertain, which poses a challenge for their cataloguing. Focusing on key HMHs (floods, storm surge, landslides, droughts, and heatwaves), the goal of this review paper is to analyse and present a classification scheme, key features, and elements for designing nature-based solutions (NBS) and mitigating the adverse impacts of HMHs in Europe. For this purpose, we systematically examined the literature on NBS classification and assessed the gaps that hinder the widespread uptake of NBS. Furthermore, we critically evaluated the existing literature to give a better understanding of the HMHs drivers and their interrelationship (causing multi-hazards). Further conceptualisation of classification scheme and categories of NBS shows that relatively few studies have been carried out on utilising the broader concepts of NBS in tackling HMHs and that the classification and effectiveness of each NBS are dependent on the location, architecture, typology, green species, environmental conditions as well as interrelated non-linear systems. NBS are often more cost-effective than hard engineering approaches used within the existing systems, especially when taking into consideration their potential co-benefits. We also evaluated the sources of available data for HMHs and NBS, highlighted gaps in data, and presented strategies to overcome the current shortcomings for the development of the NBS for HMHs. We highlighted specific gaps and barriers that need to be filled since the uptake and upscaling studies of NBS in HMHs reduction is rare. The fundamental concepts and the key technical features of past studies reviewed here could help practitioners to design and implement NBS in a real-world situation.
Doñana National Park wetlands are located in southwest Spain, on the right bank of the Guadalquivir River, near the Atlantic Ocean coast. The wetlands dry out completely every summer and progressively flood again throughout the fall and winter seasons. Given the flatness of Doñana’s topography, the wind drag action can induce the flooding or emergence of extensive areas, detectable in remote sensing images. Envisat/ASAR scenes acquired before and during strong and persistent wind episodes enabled the spatial delineation of the wind-induced water displacement. A two-dimensional hydrodynamic model of Doñana wetlands was built in 2006 with the aim to predict the effect of proposed hydrologic restoration actions within Doñana’s basin. In this work, on-site wind records and concurrent ASAR scenes are used for the calibration of the wind-drag modeling by assessing different formulations. Results show a good adjustment between the modeled and observed wind drag effect. Displacements of up to 2 km in the wind direction are satisfactorily reproduced by the hydrodynamic model, while including an atmospheric stability parameter led to no significant improvement of the results. Such evidence will contribute to a more accurate simulation of hypothetic or design scenarios, when no information is available for the atmospheric stability assessment.
Lake Titicaca is an important water ecosystem of South America. Due to uncertainties in estimating the evaporation losses from the lake, surface water storage calculations are uncertain. In this paper, we try to improve evaporation loss estimations by comparing different methods to calculate daily and monthly evaporation from Lake Titicaca. These were: water balance, heat balance, mass transfer method, and the Penman equation. The evaporation was computed at daily time step and compared with estimated evaporation using mean monthly meteorological observations. We found that the most reliable method of determining the annual lake evaporation is using the heat balance approach. To estimate the monthly lake evaporation using heat balance, the heat storage changes must be known in advance. Since convection from the surface layer is intense during nights resulting in a well-mixed top layer every morning, it is possible to determine the change of heat storage from the measured morning surface temperature. The mean annual lake evaporation was found to be 1700mm. Monthly evaporation computed using daily data and monthly means resulted in minor differences.
Lake Poopó is located in the Andean Mountain Range Plateau or Altiplano. A general decline in the lake water level has been observed in the last two decades, coinciding roughly with an intensification of agriculture exploitation, such as quinoa crops. Several factors have been linked with the shrinkage of the lake, including climate change, increased irrigation, mining extraction and population growth. Being an endorheic catchment, evapotranspiration (ET) losses are expected to be the main water output mechanism and previous studies demonstrated ET increases using Earth observation (EO) data. In this study, we seek to build upon these earlier findings by analyzing an ET time series dataset of higher spatial and temporal resolution, in conjunction with land cover and precipitation data. More specifically, we performed a spatio-temporal analysis, focusing on wet and dry periods, that showed that ET changes occur primarily in the wet period, while the dry period is approximately stationary. An analysis of vegetation trends performed using 500 MODIS vegetation index products (NDVI) also showed an overall increasing trend during the wet period. Analysis of NDVI and ET across land cover types showed that only croplands had experienced an increase in NDVI and ET losses, while natural covers showed either constant or decreasing NDVI trends together with increases in ET. The larger increase in vegetation and ET losses over agricultural regions, strongly suggests that cropping practices exacerbated water losses in these areas. This quantification provides essential information for the sustainable planning of water resources and land uses in the catchment. Finally, we examined the spatio-temporal trends of the precipitation using the newly available Climate Hazards Group Infrared Precipitation with Stations (CHIRPS-v2) product, which we validated with onsite rainfall measurements. When integrated over the entire catchment, precipitation and ET showed an average increasing trend of 5.2 mm yr−1 and 4.3 mm yr−1, respectively. This result suggests that, despite the increased ET losses, the catchment-wide water storage should have been offset by the higher precipitation. However, this result is only applicable to the catchment-wide water balance, and the location of water may have been altered (e.g., by river abstractions or by the creation of impoundments) to the detriment of the Lake Poopó downstream.
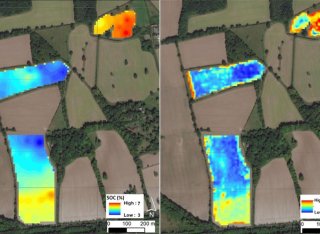
Soil organic carbon (SOC) measurements are an indicator of soil health and an important parameter for the study of land-atmosphere carbon fluxes. Field sampling provides precise measurements at the sample location but entails high costs and cannot provide detailed maps unless the sampling density is very high. Remote sensing offers the possibility to quantify SOC over large areas in a cost-effective way. As a result, numerous studies have sought to quantify SOC using Earth observation data with a focus on inter-field or regional distributions. This study took a different angle and aimed to map the spatial distribution of SOC at the intra-field scale, since this distribution provides important insights into the biophysiochemical processes involved in the retention of SOC. Instead of solely using spectral measurements to quantify SOC, topographic and spectral features act as predictor variables. The necessary data on study fields in South-East England was acquired through a detailed SOC sampling campaign, including a LiDAR survey flight. Multi-spectral Sentinel-2 data of the study fields were acquired for the exact day of the sampling campaign, and for an interval of 18 months before and after this date. Random Forest (RF) and Support Vector Regression (SVR) models were trained and tested on the spectral and topographical data of the fields to predict the observed SOC values. Five different sets of model predictors were assessed, by using independently and in combination, single and multidate spectral data, and topographical features for the SOC sampling points. Both, RF and SVR models performed best when trained on multi-temporal Sentinel-2 data together with topographic features, achieving validation root-mean-square errors (RMSEs) of 0.29% and 0.23% SOC, respectively. These RMSEs are competitive when compared with those found in the literature for similar models. The topographic wetness index (TWI) exhibited the highest permutation importance for virtually all models. Given that farming practices within each field are the same, this result suggests an important role of soil moisture in SOC retention. Contrary to findings in dryer climates or in studies encompassing larger areas, TWI was negatively related to SOC levels in the study fields, suggesting a different role of soil wetness in the SOC storage in climates characterized by excess rainfall and poorly drained soils.
Lake Poopó is located in the Andean Mountain Range Plateau or Altiplano. A generalised decline in the lake water level has been observed since 2001, coinciding roughly with an intensification of agriculture exploitations such as quinoa crops. Several factors have been blamed for the lake recession, including climate change, increased farming, mining abstractions and population growth. Being an endorheic catchment, evapotranspiration (ET) losses are expected to be the main water output mechanism. This study used a time series of more than 1000 satellite data based products to map ET and vegetation index trends in the Poopó catchment between 2001 and 2014. The aim was to explore the links between ET, vegetation, land use and the lake recession. The years 2015 and 2016 were excluded of the analysis due to the strong impact of El Niño phenomenon over the study area, which could have masked long term temporal trends related to land use. We quantified the ET losses and vegetation indices for the main cover types in the Poopó catchment and their temporal trends in the study period. It became obvious that cultivated areas were the ones which had experienced the largest increase in water consumption, although they were not in all instances the land covers with the largest losses. This quantification provides essential information for the sustainable planning of water resources and land uses in the catchment. We also collected on-site and satellite precipitation data. When integrated over the entire catchment, the overall ET losses showed a sustained increasing trend at an average rate of 3.2 mm yr−1. Rainfall water inputs followed a similar trend, with a slightly higher increasing rate of 5.2 mm yr−1. Based on these results and from the point of view of the catchment water balance, the ET loss intensification derived from crop expansion has been compensated by the increase in precipitation. Consequently, this study found no clear link between the agriculture intensification and the Lake Poopó recession in the analysed period.
We used Landsat 8 thermal images to study the longitudinal patterns of surface water temperature in the Mequinenza reservoir, Spain, in 2016. We also estimated its thermal impact on the river by comparing upstream and downstream temperatures.
ASTER images were used for mapping the water surface temperature in the Mequinenza and the Ribarroja reservoirs, on the Ebro River. The spatially continuous information of these maps reveals the impact of the reservoir on the river’s natural thermal gradient in two different periods of the year. The high spatial resolution images of the Ribarroja reservoir, acquired by the airborne hyperspectral TASI sensor,
Onsite and Earth observation (EO) data are used for the calibration of the Natural Resources Conservation Service curve number (NRCS-CN) value in a hydrological simulation model. The model was developed for La Muga catchment (eastern Pyrenees) highly vulnerable to flood and drought episodes. It is an integral part of a regional reservoir management tool, which aims at minimizing the flood risk while maximizing the preservation of water storage. The CN values were optimized for five recorded events for the model to match the observed hydrographs at the reservoir when supported with the measured rainfall intensities. This study also investigates the possibilities of using antecedent moisture conditions (AMC) retrieved from satellite data to inform the selection of the NRCS-CN losses parameter. A good correlation was found between the calibrated CN values and the AMC obtained from satellite data. This correlation highlights the interest in using EO data to update NRCS-CN estimates. This advances in hydrologic-hydraulic coupled modeling combined with new remote sensing datasets present valuable opportunities and potential benefits for flood risk management and water resources preservation.
The transport of wood material in rivers has been the subject of various studies in recent years. Most research has focused on the ecological and geomorphologic role of wood, its recruitment processes and spatial distribution in streams. In this study, we focused on wood transport dynamics, and we have developed a numerical model to simulate wood transport coupled with a two-dimensional (2D) hydrodynamic model. For this purpose, wood drag forces were incorporated as additional source terms into the shallow water equations, which are solved together with wood transport by using the finite volume method. This new tool has been implemented as a computational module into ‘Iber’, a 2D hydraulic simulation software. The new module analyzes the initial motion threshold of wood based on the balance of forces involved in the wood’s movement, and computes the position and velocity of differently shaped logs using a kinematic approach. The method also considers the interaction between the logs themselves and between the logs and the channel walls or boundaries. Flume experiments were used in a straight channel with obstructions to validate the model’s capacity to accurately reproduce the movement of floating logs
Nature-based solutions (NBS) for hydro-meteorological risks (HMRs) reduction and management are becoming increasingly popular, but challenges such as the lack of well-recognised standard methodologies to evaluate their performance and upscale their implementation remain. We systematically evaluate the current state-of-the art on the models and tools that are utilised for the optimum allocation, design and efficiency evaluation of NBS for five HMRs (flooding, droughts, heatwaves, landslides, and storm surges and coastal erosion). We found that methods to assess the complex issue of NBS efficiency and cost-benefits analysis are still in the development stage and they have only been implemented through the methodologies developed for other purposes such as fluid dynamics models in micro and catchment scale contexts. Of the reviewed numerical models and tools MIKE-SHE, SWMM (for floods), ParFlow-TREES, ACRU, SIMGRO (for droughts), WRF, ENVI-met (for heatwaves), FUNWAVE-TVD, BROOK90 (for landslides), TELEMAC and ADCIRC (for storm surges) are more flexible to evaluate the performance and effectiveness of specific NBS such as wetlands, ponds, trees, parks, grass, green roof/walls, tree roots, vegetations, coral reefs, mangroves, sea grasses, oyster reefs, sea salt marshes, sandy beaches and dunes. We conclude that the models and tools that are capable of assessing the multiple benefits, particularly the performance and cost-effectiveness of NBS for HMR reduction and management are not readily available. Thus, our synthesis of modelling methods can facilitate their selection that can maximise opportunities and refute the current political hesitation of NBS deployment compared with grey solutions for HMR management but also for the provision of a wide range of social and economic co-benefits. However, there is still a need for bespoke modelling tools that can holistically assess the various components of NBS from an HMR reduction and management perspective. Such tools can facilitate impact assessment modelling under different NBS scenarios to build a solid evidence base for upscaling and replicating the implementation of NBS. [Display omitted]
This study undertakes a spatio-temporal assessment of the annual and seasonal precipitation trends over the Desaguadero-Poopó (DP) system in Bolivia for the period 1981-2018. Given the insufficient spatial density of meteorological stations in the study, the high-spatial resolution Climate Hazards group Infrared Precipitation with Stations (CHIRPS) satellite product was used. CHIRPS precipitation data was validated against 7,636 gauge measurements and used to map the spatial distribution of precipitation trends. In addition, the temporal changes in the onset, duration and average intensity of the wet season were explored. Results showed a good, statistically significant agreement between CHIRPS data and onsite records of monthly precipitation at the pixel and regional scales. The spatio-temporal precipitation assessment revealed that statistically significant increases in annual precipitation (2– 6 mm yr-1) occurred in two zones at the north and north-western part of the DP system. Only the southern part showed decreasing precipitation trends at a rate of -1 mm yr-1 while the central part did not show significant changes. Overall, a general increasing trend of about 2.5 mm yr-1 was observed for the entire DP system during the 38-year study period, with the months of December and February showing the highest significant increases. The analysis of the onset and cessation times of the rainy season indicated a statistically significant decrease in its duration at a rate of -0.4 day yr-1 and an increment of the average precipitation intensity. Our results reveal trend in the temporal concentration of precipitation in a water scarce region, which highlights the need for the management of the resource, so it can meet societal and environmental demands throughout the year.
Lake Poopó is located in the Andean Mountain Range Plateau or Altiplano. A general decline in the lake water level has been observed in the last two decades, coinciding roughly with an intensification of agriculture exploitation, such as quinoa crops. Several factors have been linked with the shrinkage of the lake, including climate change, increased irrigation, mining extraction and population growth. Being an endorheic catchment, evapotranspiration (ET) losses are expected to be the main water output mechanism and previous studies demonstrated ET increases using Earth observation (EO) data. In this study, we seek to build upon these earlier findings by analyzing an ET time series dataset of higher spatial and temporal resolution, in conjunction with land cover and precipitation data. More specifically, we performed a spatio-temporal analysis, focusing on wet and dry periods, that showed that ET changes occur primarily in the wet period, while the dry period is approximately stationary. An analysis of vegetation trends performed using 500 MODIS vegetation index products (NDVI) also showed an overall increasing trend during the wet period. Analysis of NDVI and ET across land cover types showed that only croplands had experienced an increase in NDVI and ET losses, while natural covers showed either constant or decreasing NDVI trends together with increases in ET. The larger increase in vegetation and ET losses over agricultural regions, strongly suggests that cropping practices exacerbated water losses in these areas. This quantification provides essential information for the sustainable planning of water resources and land uses in the catchment. Finally, we examined the spatio-temporal trends of the precipitation using the newly available Climate Hazards Group Infrared Precipitation with Stations (CHIRPS-v2) product, which we validated with onsite rainfall measurements. When integrated over the entire catchment, precipitation and ET showed an average increasing trend of 5.2 mm yr−1 and 4.3 mm yr−1, respectively. This result suggests that, despite the increased ET losses, the catchment-wide water storage should have been offset by the higher precipitation. However, this result is only applicable to the catchment-wide water balance, and the location of water may have been altered (e.g., by river abstractions or by the creation of impoundments) to the detriment of the Lake Poopó downstream.
This paper explores a geometrical and computationally simple operator, named Ds, for local isotropy assessment on SAR images. It is assumed that isotropic intensity distributions in natural areas, either textured or nontextured, correspond to a single cover class. Ds is used to measure isotropy in processing neighborhoods and decide if they can be considered as belonging to a unique cover class. The speckle statistical properties are used to determine suitable Ds thresholds for discriminating heterogeneous targets from isotropic cover types at different window sizes. An assessment of Ds as an edge detector showed sensitivities similar to those of the ratio edge operator for straight, sharp boundaries, centered in the processing window, but significantly better sensitivity for detecting heterogeneities during the window expansion in multiresolution filtering. Furthermore, Ds presents the advantage versus the ratio edge coefficient of being rotationally invariant, and its computation indicates the direction of the main intensity gradient in the processing window. The Ds operator is used in a multiresolution fashion for filtering ASAR scenes of the Doñana wetland. The intensities in isotropic areas are averaged in order to flatten fluctuations within cover types and facilitate a subsequent land cover classification. The results show high degree of smoothing within textured cover classes, plus effective spatial adaptation to gradients and irregular boundaries, substantiating the usefulness of this operator for filtering SAR data of natural areas with the purpose of classification.
Lake Titicaca is a crucial water resource in the central part of the Andean mountain range, and it is one of the lakes most affected by climate warming. Since surface evaporation explains most of the lake’s water losses, reliable estimates are paramount to the prediction of global warming impacts on Lake Titicaca and to the region’s water resource planning and adaptation to climate change. Evaporation estimates were done in the past at monthly time steps and using the four methods as follows: water balance, heat balance, and the mass transfer and Penman’s equations. The obtained annual evaporation values showed significant dispersion. This study used new, daily frequency hydrometeorological measurements. Evaporation losses were calculated following the mentioned methods using both daily records and their monthly averages to assess the impact of higher temporal resolution data in the evaporation estimates. Changes in the lake heat storage needed for the heat balance method were estimated based on the morning water surface temperature, because convection during nights results in a well-mixed top layer every morning over a constant temperature depth. We found that the most reliable method for determining the annual lake evaporation was the heat balance approach, although the Penman equation allows for an easier implementation based on generally available meteorological parameters. The mean annual lake evaporation was found to be 1700mmyearˉ¹. This value is considered an upper limit of the annual evaporation, since the main study period was abnormally warm. The obtained upper limit lowers by 200mmyearˉ¹, the highest evaporation estimation obtained previously, thus reducing the uncertainty in the actual value. Regarding the evaporation estimates using daily and monthly averages, these resulted in minor differences for all methodologies.
Thermal images of water bodies often show a radiance gradient perpendicular to the banks. This effect is frequently due to mixed land and water thermal pixels. In the case of the Landsat images, radiance mixing can also affect pure water pixels due the cubic convolution resampling of the native thermal measurements. Some authors recommended a general-purpose margin of two thermal pixels to the banks or a minimum river width of three pixels, to avoid near bank effects in water temperature retrievals. Given the relatively course spatial resolution of satellite thermal sensors, the three pixel margin severely restricts their application to temperature mapping in many rivers. This study proposes a new algorithm to enhance the retrieval of stream surface temperature using Landsat 8 thermal data, although it is also applicable to Landsat 7 and Landsat 5. The aim is not to perform a subpixel radiance unmixing but to refine the selection of unmixed, reliable pixels for temperature mapping. For this purpose, the spatial arrangement of native Landsat thermal pixels is approximated, and pure water pixels in the downscaled thermal band are selected accordingly. The least-favourable cubic convolution near-bank radiance mixing is simulated on image basis. Only pure thermal water pixels unaffected by the simulated worstcase resampling are selected. The algorithm allowed retrieving water surface temperature in reaches down to 120m wide, clearly improving the existing three pixel, i.e. 300m for Landsat 8, recommendation. The enhancing algorithm was applied to a reach in the Ebro River reach, Spain. It provided spatially distributed temperatures in narrow parts, upstream and downstream of a wide reservoir, offering new insight of the overall impact of the reservoir over the river thermal regime.
To bring to fruition the capability of nature-based solutions (NBS) in mitigating hydro-meteorological risks (HMRs) and facilitate their widespread uptake require a consolidated knowledge-base related to their monitoring methods, efficiency, functioning and the ecosystem services they provide. We attempt to fill this knowledge gap by reviewing and compiling the existing scientific literature on methods, including ground-based measurements (e.g. gauging stations, wireless sensor network) and remote sensing observations (e.g. from topographic LiDAR, multispectral and radar sensors) that have been used and/or can be relevant to monitor the performance of NBS against five HMRs: floods, droughts, heatwaves, landslides, and storm surges and coastal erosion. These can allow the mapping of the risks and impacts of the specific hydro-meteorological events. We found that the selection and application of monitoring methods mostly rely on the particular NBS being monitored, resource availability (e.g. time, budget, space) and type of HMRs. No standalone method currently exists that can allow monitoring the performance of NBS in its broadest view. However, equipments, tools and technologies developed for other purposes, such as for ground-based measurements and atmospheric observations, can be applied to accurately monitor the performance of NBS to mitigate HMRs. We also focused on the capabilities of passive and active remote sensing, pointing out their associated opportunities and difficulties for NBS monitoring application. We conclude that the advancement in airborne and satellite-based remote sensing technology has signified a leap in the systematic monitoring of NBS performance, as well as provided a robust way for the spatial and temporal comparison of NBS intervention versus its absence. This improved performance measurement can support the evaluation of existing uncertainty and scepticism in selecting NBS over the artificially built concrete structures or grey approaches by addressing the questions of performance precariousness. Remote sensing technical developments, however, take time to shift toward a state of operational readiness for monitoring the progress of NBS in place (e.g. green NBS growth rate, their changes and effectiveness through time). More research is required to develop a holistic approach, which could routinely and continually monitor the performance of NBS over a large scale of intervention. This performance evaluation could increase the ecological and socio-economic benefits of NBS, and also create high levels of their acceptance and confidence by overcoming potential scepticism of NBS implementations.
